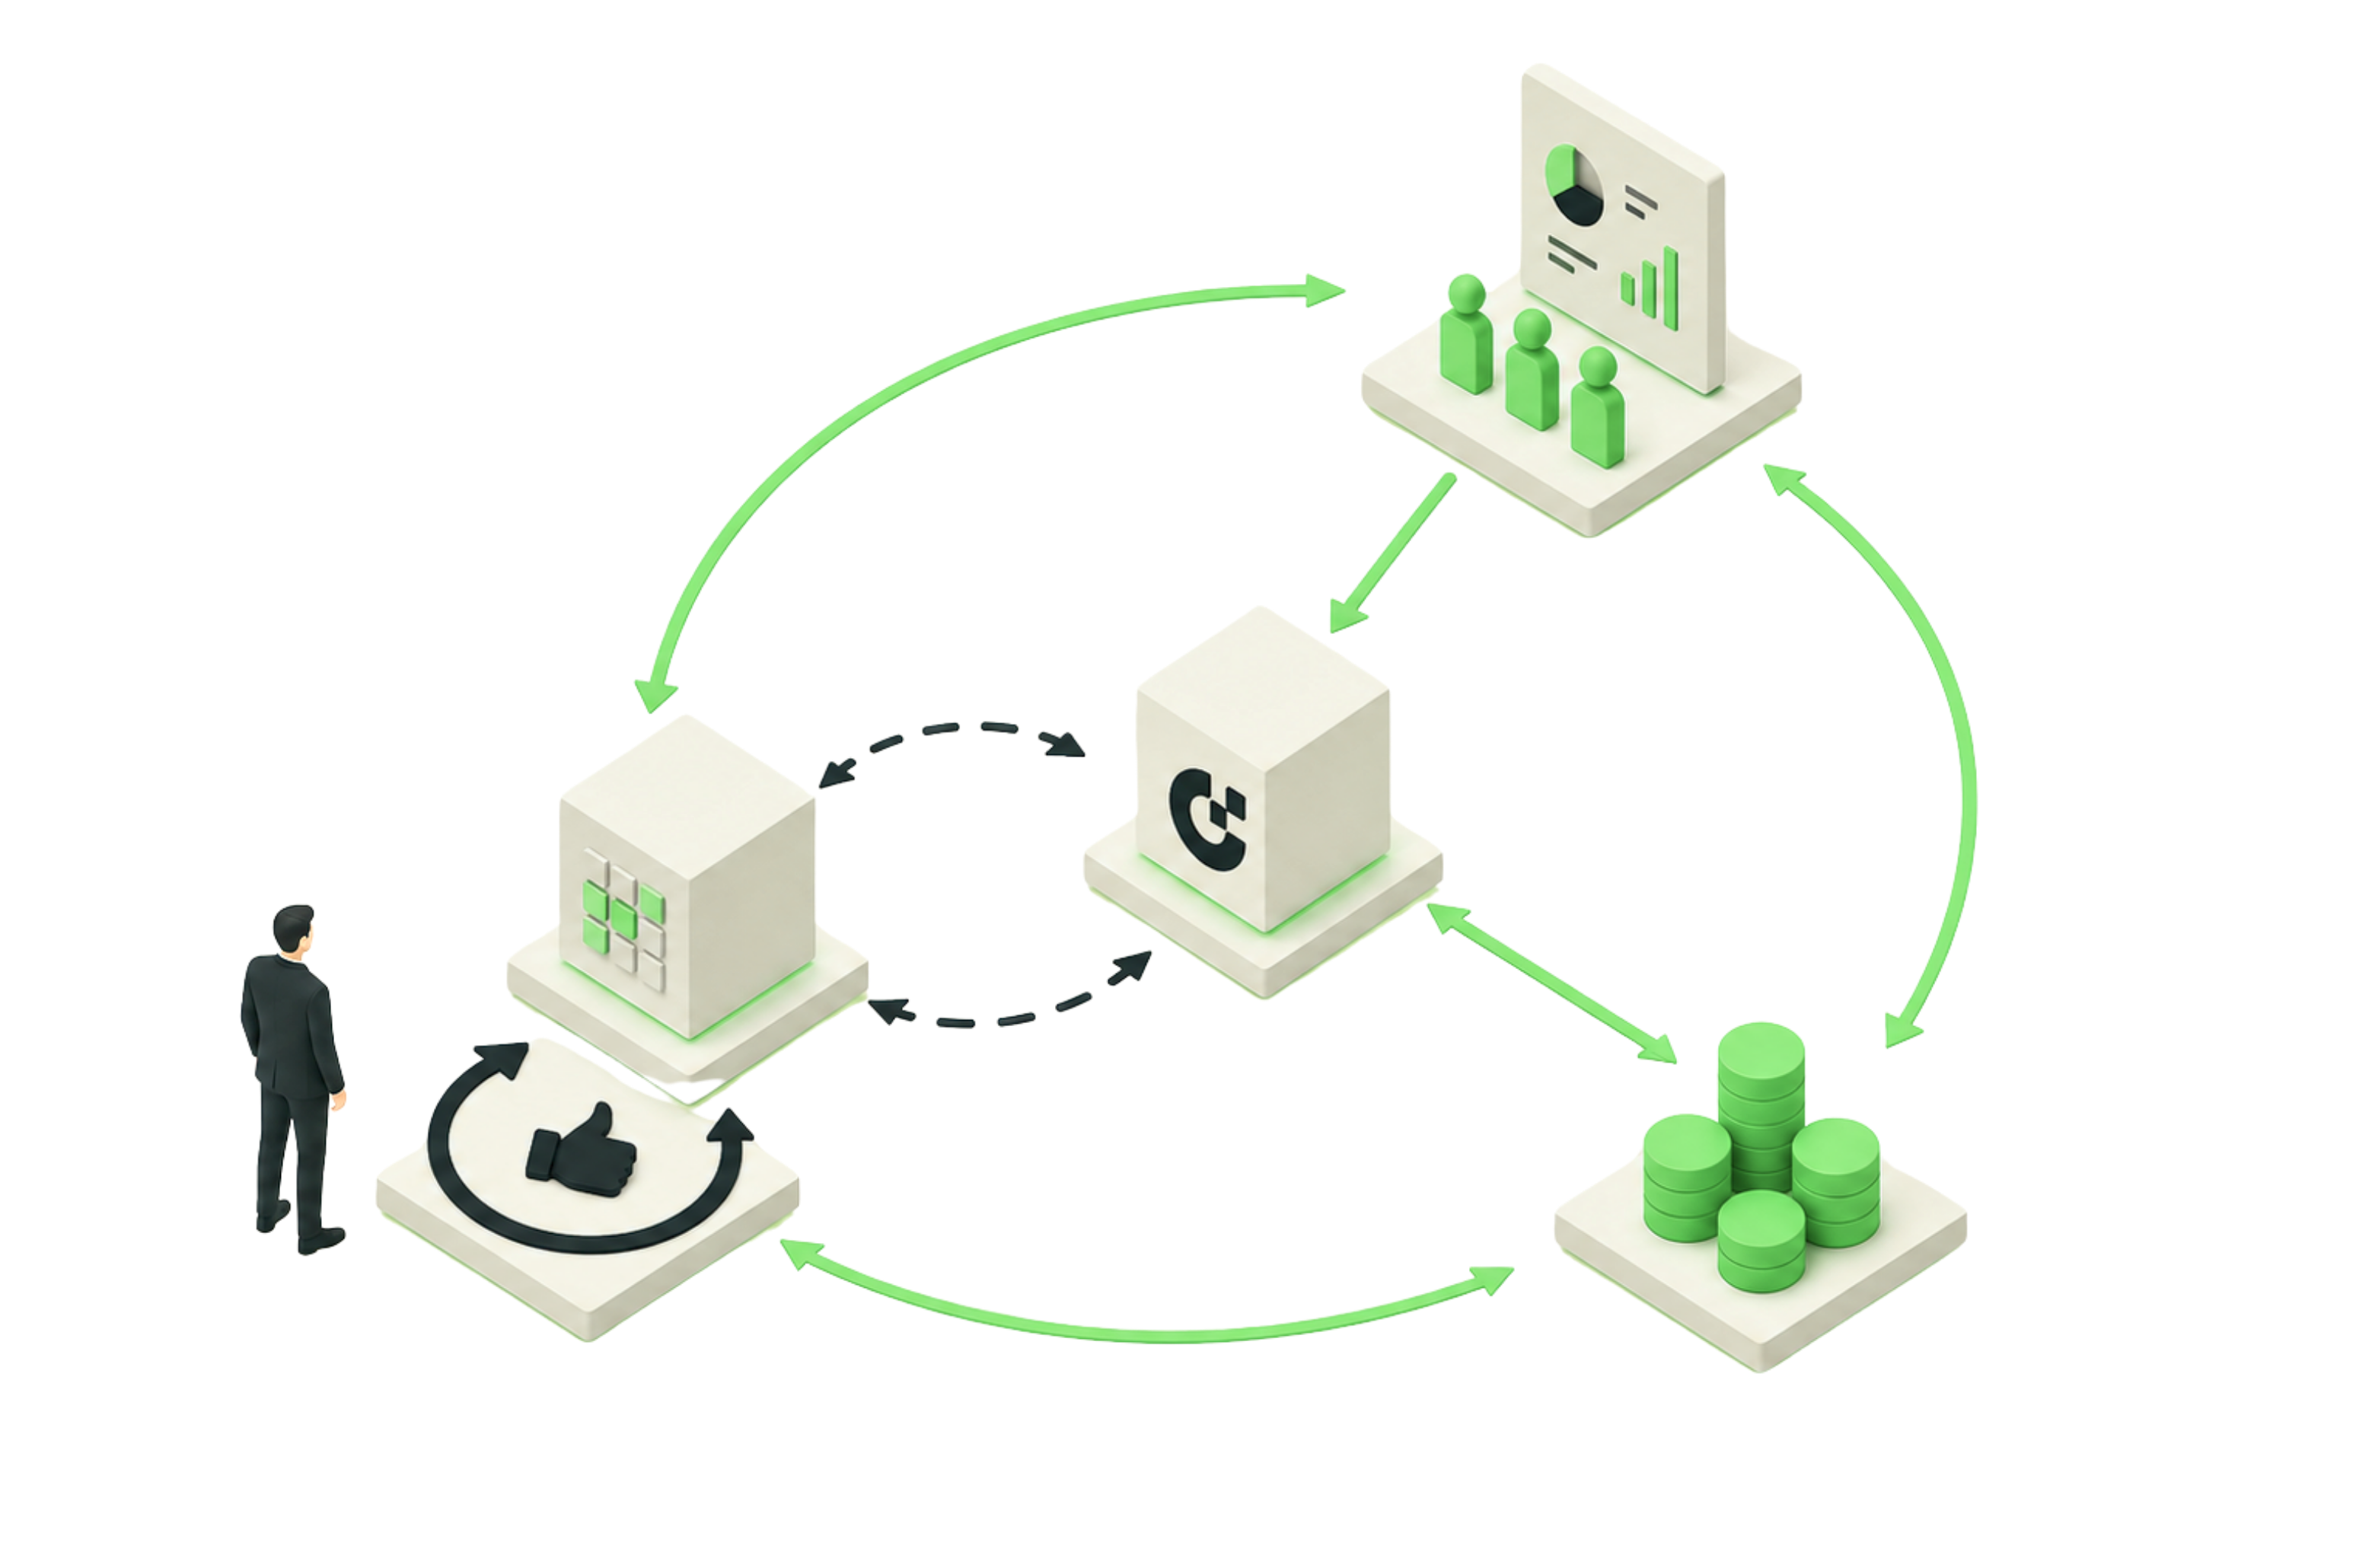
You already know the day-7 number is lying to you.
A channel looks awful in January so you cut it, and it turns out January was the best cohort you bought all year. Someone runs a promo that pushes signups onto the annual plan, day-7 ROAS jumps forty percent, you scale into it, and the business underneath barely moves. Six months later the payback curve tells you what actually happened.
The fix is a cohort pLTV model. Something that takes the people who signed up this week and tells you, on day 7, what they are really going to be worth. Until recently that meant hiring a data scientist, or waiting two quarters for one to have capacity. Not anymore. You can build a working version this week by pointing Claude at your warehouse, and the code is genuinely the easy part.
Here is the catch, and it is the whole reason this guide exists. A model built in an afternoon will run without complaining, produce numbers that look completely reasonable in a dashboard, and still be wrong. The ways it goes wrong are not coding errors, so nothing crashes and Claude never flags them. They are definition errors, data errors and testing errors, and those are yours to own.
The short version, if you read nothing else: start with one regression, and make anything more sophisticated beat it before you let it near your budget.
Pick your own numbers as you read, the argument does not change. Ours is a consumer subscription app:
This is the part everyone skips and it is where most of these models break. Four questions, four written answers, and the answers have to be identical in your training data, your backtest and your live pipeline. Put them in a doc before you write a prompt.
When does the clock start? The first time you see the user, trial start, subscription start, or first payment? Those are four different groups of people with four different values, and it is very common to find one definition in the model and a different one in the dashboard nobody ever reconciled. Ours starts at trial start.
When do you make the call? Day 7 for us, because that is when we move budget. This one has teeth. Any data point that only exists on day 30 is off the table, however well it predicts.
What exactly are you predicting? Revenue before refunds, after refunds, or after cost of goods too? We use net revenue per user with refunds already taken out, because that is the money that pays for media.
How far out? 24 months. Write it on every chart you ever make. A six-month number and a 24-month number look identical on a slide and differ by a factor of two, and sooner or later somebody quotes one as the other in a board meeting.
With those four pinned, a cohort is everyone whose clock started in the same week. The model gives you one number per user on day 7, they add up to a number per cohort, and that number does two jobs: deciding where budget goes, and letting you compare channels at the same cohort age instead of comparing a three-week-old cohort with a year-old one.
Before any code at all, push your configuration through by hand. Per 100 trial starts, 60 convert.
Sit with the middle two rows for a second. Your yearly plan is three quarters of the cash you can see on day 7 and one third of the value that eventually arrives. Monthly is the exact mirror image.
Now that promo. Shift the mix to 50/50 and week-one cash jumps about 42% while real cohort value moves about 4%. Anyone reading early ROAS without checking plan mix calls that a win, and they are wrong by an order of magnitude. Seasonality does the same damage from the other direction: a model that has quietly settled on “conversion is 60%” underprices your Q5 cohorts by about 14% and overprices dead-season cohorts by about 50%.
Plan mix and the season are the actual problem. Which algorithm gets used is a rounding error next to them. That is also exactly why one regression usually works: give it plan and channel as inputs and it can learn most of this on its own.
Ask before you model. This question kills more of these projects than any modelling mistake, and it does it quietly.
Start with three sources and nothing else. Acquisition data, meaning channel, campaign, geo, device and signup date. Payment data, every charge and every refund, with timestamps. Renewal and cancellation events, with timestamps. That is enough for a model that works. In-app events, engagement scores and survey answers can come later, and each one should have to earn its place. Fewer fields that are right beat more fields that are nearly right, and three clean sources that ship this month beat twelve sources still being reconciled at Christmas.
Then check two things about every field you kept.
Does it arrive in time? If a payment lands in your warehouse three days after it happened, your day-7 prediction in production is really running on four days of data, while the model was trained on all seven. Your backtest looks clean, the live model underperforms, and nobody can work out why.
Does it stay put? A refund that rewrites the original charge row. A subscription whose status field gets overwritten in place. A campaign renamed retroactively so last quarter’s spend quietly moves. If you cannot reconstruct what a row looked like on the day you would have made the prediction, you cannot test the model honestly. Full stop.
Where the answer to either is no, find another source or wait until it settles down. Taking a daily snapshot of the tables you depend on is cheap insurance and much easier to set up now than to bolt on in six months.
There are three versions of this model. Build the simplest one, and only move up when your own data tells you to.
Version one, no model at all. A cohort table and one multiple. Take the cohorts old enough to have matured, divide value at 24 months by cash at day 7, and you have a number you can defend in a budget meeting. For this app it is about 2.8x, meaning roughly 64% of the value has not arrived yet on the day you decide. Add a maturity curve, which is just the share of final value that has landed by each month of age, so a three-week-old cohort gets compared with an old one at the same age instead of looking like a disaster. With less than six months of clean history this is the honest answer, and shipping it is a result rather than a failure to build something.
Version two, one regression on the outcome. One model. Inputs from your three sources as they existed on day 7, output is the number you defined. Tell Claude to use squared error on the raw amount, because that aims at the average, and the average is what your budget actually spends. Linear regression or gradient boosting, whichever your team can debug on a Friday evening. This is not a warm-up. For a lot of businesses this is the finished model, and it is what anything fancier has to beat.
Version three, separate models for the moving parts. Roughly five pieces: how long someone keeps paying, which plan they pick, whether the season shifts conversion, who refunds immediately, whether the annual renews. Each one fitted separately and multiplied back together at the end. It really is more accurate when those pieces behave very differently. It is also five things to build, test, explain and re-run every month.
The rule that keeps you honest: version three ships because it beat version two on the cohorts you actually allocate against. Not because it is more sophisticated, and not because it looks like what a data science team ought to produce. If it does not win, you learned that cheaply and the regression stays.
What tells you to climb is the errors. If your regression is wrong in a pattern that lines up with plan mix, or with the season, that is your evidence, and it also tells you which piece to pull out first.
For the cohort table and the regression: pandas, numpy, and scikit-learn or LightGBM. That is the whole list. Have Claude build the cohort table first and reconcile it to your billing revenue to the cent, because every model above it gets graded against that table.
If your testing does send you to version three, these are the names to give Claude:
One to refuse outright: lifetimes. It is barely maintained, and its headline models are built for businesses that never find out when a customer leaves, like a retailer waiting to see whether you shop again. A subscription business watches every renewal happen. Claude will suggest it constantly because it is the top Google result for “python lifetime value”, and the code will run perfectly while being wrong at the foundation.
It will build this in hours rather than weeks and make the same mistakes nearly every time. All of them are quiet. The code runs, the metrics look fine, the model is wrong.
The fix is not better prompting in the moment. Write the rules first: the four definitions, the three data sources, that list as a “do not do this” file, and a hard rule that nobody sees a prediction until the checks below have run. Treat Claude like a very fast, very confident new hire whose output quality is set by the tests you write.
Order matters. The cheap checks catch most of the errors, in an afternoon instead of a quarter.
The real test is a replay. Freeze the world at a date, delete everything after it, predict, then grade only once those cohorts have actually matured. Do that at twenty or more dates spread across at least a full year, and make sure the year includes both a Q5 and a dead season. With conversion swinging between 40 and 70%, a test that misses either extreme tells you nothing.
Two details teams learn the hard way. Cohorts that overlap in time share the same shocks, a platform outage or a tracking bug, so your error bars need to account for that or they come out far too narrow and you trust the model more than you should. And save every version of the model with the date it was trained, so the replay uses the model that would have existed then rather than today’s code applied to old data.
This whole playbook ships as a Claude skill, cohort-pltv-builder.skill, so the discipline travels with the model instead of living in one person’s head. Once it is saved it triggers whenever anyone asks Claude to build, forecast or debug an LTV model, and it enforces the order above. Pin the four definitions. Check the data is available live. Build the cohort table and the multiple. Fit one regression. Run the cheap checks. Replay against history. Only then consider splitting the model up. It also hard-codes that “do not do this” list as a self-review Claude runs before showing you anything, including a refusal to show predictions before the validation report exists.
The point is not that Claude cannot write this code without it. Obviously it can. The point is that the skill makes the tests non-negotiable, and the tests are where do-it-yourself models actually fail.
Everything above is a cohort model for your own decisions: what a week of signups from a channel is worth, so you can move budget and report honestly. That is the right first build and it will pay for itself.
Sending value signals back into Meta, Google or AppLovin is a different problem, and a much harder one.
It has to be per user, not per cohort, because a cohort average tells the platform nothing about which specific person to go and find more of. It has to arrive inside the learning window, and platforms largely stop learning from an event a day or so after it happens, so a signal that needs seven days of data is already too late and you end up predicting your own prediction. It has to be causal, because correlations that predict value perfectly well in your warehouse are often just artefacts of who the platform already decided to send you, and feeding those back teaches the algorithm to double down on what it was already doing. And the stakes are different in kind: a miscalibrated cohort model gives you a wrong number in a dashboard, while a miscalibrated bidding signal actively spends your money acquiring the wrong users, and it compounds every day you leave it running.
Then add privacy constraints and aggregated attribution windows, incrementality testing to find out whether the platform’s own reporting is telling you the truth, and separate activation work for every network. That is not a weekend with Claude.
That part is what we do. If you have built the model above and want to talk about what you send to the platforms, or you would like someone to pressure-test the model you already have before it starts moving next quarter’s budget, book a call and we will go through your cohorts with you.
A build guide for the growth marketer who wants to point Claude at their own cohort data. The code is the easy part. The definitions, the data pipeline and the tests are where these models quietly go wrong, and those are the parts you own.