Our goal is to help you optimise advertising campaigns using predictive Lifetime Value (pLTV) models, improving user acquisition efficiency and return on ad spend (ROAS).
To do this we need specific raw data from your side. This guide explains the data we require for initial sync and ongoing operations, why each data type matters for model accuracy, and the practices that keep the integration smooth.
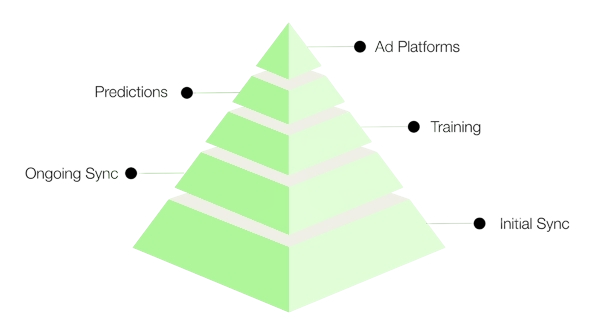
COALESCE() across several. See the red flag in section 4C.Our pLTV process turns your raw user data into signals for your ad platforms.
Timestamped event data capturing user actions and system telemetry: revenue events (purchases, subscriptions, in-app payments), business interactions (trial sign-ups, cancellations, support contacts), user actions (add to cart, game progress, newsletter sign-ups) and telemetry (sessions, app opens, page views).
At minimum every row needs event_timestamp, event_name and user_id. Revenue events also need a revenue field. Provide all available context columns and deliver as raw logs. Firebase or GA4 export format is ideal.
{
  "event_timestamp": "2025-07-28T14:22:15Z",
  "event_name": "purchase",
  "user_id": "abc123",
  "revenue": 12.99,
  "device_os": "iOS",
  "country": "US"
}
Check it yourself: count events per day for the last 30 days. Flat or missing days mean the export is dropping data. A sharp cut at a round number means a row limit in the query.
Red flag: only purchase events were exported.
A purchases-only feed cannot tell the model what a future buyer looks like before they buy. If your event table is filtered to revenue events, send the unfiltered log instead. Sessions, app opens and in-product actions are what generate early predictions.
Check it yourself: list the distinct values ofevent_name. If there are fewer than ten, the log is probably filtered.
Attributes tied to each user: demographics, device info, registration details. We use these for feature generation and for regional and platform-specific model adjustments.
{
  "user_id": "abc123",
  "registration_date": "2025-01-10",
  "country": "US",
  "device_os": "Android",
  "age_group": "25-34",
  "signup_channel": "Facebook Ads"
}
Check it yourself: pick five user IDs from your event log and look them up in the user table. If any are missing, the two tables are built from different populations and we need to know why.
Red flag: the user table is overwritten on every load.
If the user table is rebuilt as a snapshot of today, yesterday's state is gone and the model can learn from attributes that did not exist when a user signed up. Keep a dated history, or send us the snapshot with a load date so we can reconstruct one.
Check it yourself: is there a column recording when the row was written? If not, the table is almost certainly a full refresh.
Identifiers that let us link a user across your tables and to your ad platforms and MMPs:
email and google_email, phone and google_phone, first name, last name, date of birth, city, postal code. Ad platforms normalise these differently, so your warehouse integration guide gives the exact SQL. Phone numbers must include a country code.If several ID systems exist, send each one as its own column plus any mapping table you have that links them together.
Red flag: don't send us a coalesced "master" user ID.
If your systems use more than one user ID (e.g. a payment ID, an account ID, a device ID), please don't merge them into a single column with fallback logic likeCOALESCE(id_a, id_b, id_c)before sending us data. It is tempting because it guarantees every row has some ID, but it silently breaks the link between a user's purchases and their other activity, since payment and purchase data almost always uses only one of those ID types.
What happens if you do: users who only ever show up under a "secondary" ID type will look like they never generate revenue. That skews the model in ways that are very hard to catch after the fact. It does not throw an error, it quietly degrades accuracy.
What to send instead: the raw, un-merged ID column(s) as they exist in each table, plus a mapping table if you have one that links the different ID types together. We will handle reconciling them on our end.
How to check yourself before sending: look at the actual values in youruser_idcolumn. If they are all the same format (all UUIDs, or all integers, etc.), you are likely fine. If you see a mix of formats in the same column, that is a sign it has already been coalesced. Split it back into its source columns.
This same issue can happen with timestamps pulled from multiple source columns. Same rule applies.
User acquisition details (campaign, channel, platform) from UTM parameters, ad network identifiers or a mobile measurement partner (AppsFlyer, Singular, Adjust). We use these to measure campaign ROI, validate pLTV accuracy and stay aligned with your own attribution model.
Check it yourself: compare total installs or sign-ups in your attribution table for last month against the same figure in your event log. If they differ by more than a few percent, tell us which one you treat as the source of truth.
Red flag: attribution methodology not shared upfront.
Different attribution windows and models produce different numbers for the same campaign. If we do not know which one you use, our reported lift will not reconcile with your dashboards and the measurement conversation stalls. Send the methodology with the data, not after the first report.
To summarise, below you may find a diagram of the core variables we need. For a deeper dive into table structures and vertical-specific examples, contact us to get more data schema examples.
.png)
Check it yourself: run the same row-count query on a table two days apart. If the count for a past date changed, the load is not append-only.
Red flag: full refreshes instead of incremental loads.
A full refresh replaces history every run, so anything corrected upstream silently rewrites the past. The model then trains on facts that were not knowable at prediction time, which inflates offline accuracy and disappoints in production.
Check it yourself: look for a load or ingestion timestamp on each row, and confirm yesterday's rows keep the same values today. Truncate-and-insert patterns in your pipeline are the usual culprit.
Red flag: timestamps in local time, or mixed timezones.
Mixed timezones move events across day boundaries and break the ordering the model relies on. Convert everything to UTC at the source, and tell us if a table was ever recorded in local time.
Check it yourself: plot events per hour of day. A pattern that shifts by whole hours partway through the history means the timezone changed.
If you cannot fully meet these requirements, we can connect you with a Churney Data Partner who will handle end-to-end cleanup and setup, typically within about three weeks. Contact your Churney point of contact for assistance.
Your data warehouse has incredible value. Our causal AI helps unlock it.